
Data Analytics Services
If you are evaluating data analytics services, the business problem is usually the same: your data lives in multiple systems, teams rely on different versions of the truth, and reports take too long to produce. A professional data analytics service helps unify those sources, standardize metrics, and deliver dashboards and insights that stakeholders can trust.
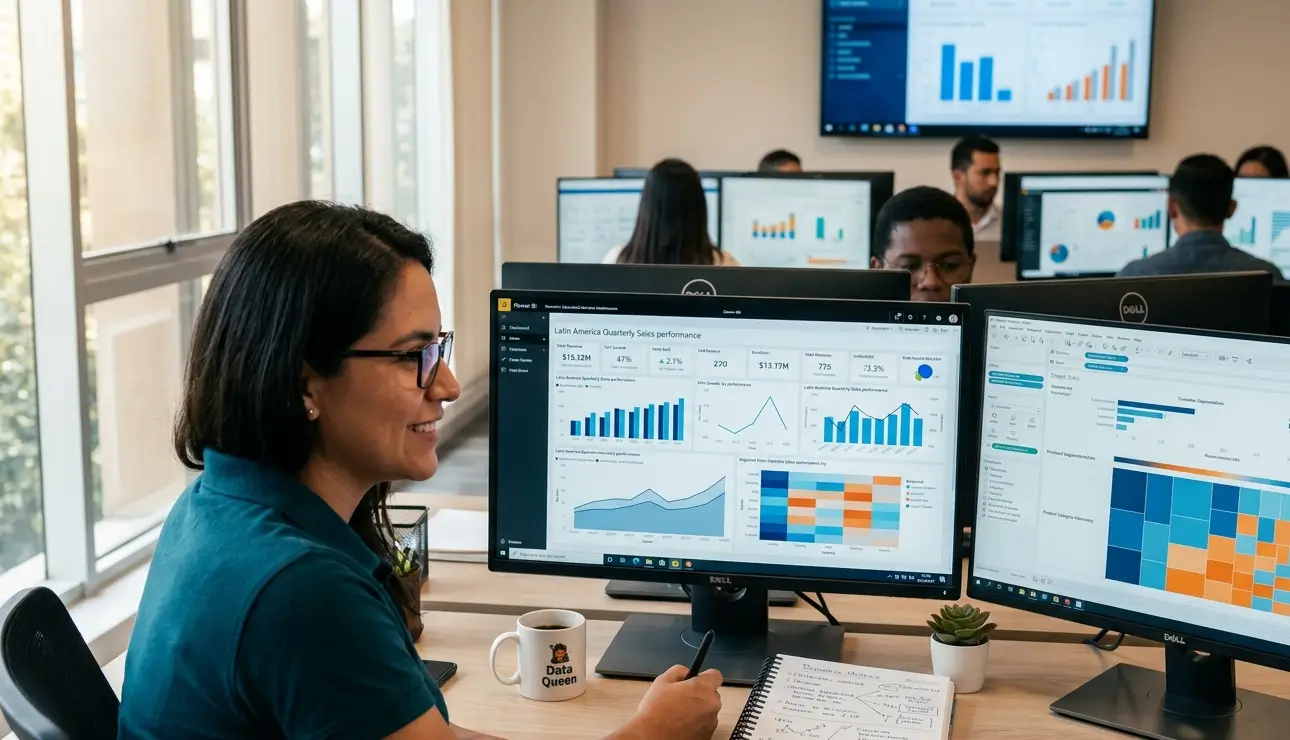
CodersLab connects US and international enterprises with certified data analytics engineers based across LATAM, covering business intelligence, data visualization, predictive analytics, and the governance practices that keep analytics reliable at scale. Our teams work in US-aligned time zones and are experienced with Tableau, Power BI, Looker, and modern data stack environments.

Market growth remains strong

The data analytics market continues to expand as enterprises adopt cloud BI, governance, and AI-ready pipelines.
Mordor Intelligence, 2026Self-service analytics is now standard

Modern analytics teams increasingly use cloud-native tools like Looker, Tableau Cloud, and Power BI Service.
Industry trendNearshore talent improves speed

Nearshore analytics teams can help companies move faster while keeping communication easier across time zones.
CodersLab positioningWhy the data analytics market keeps growing
The global data analytics market continues to expand as organizations adopt cloud platforms, self-service BI, and AI-ready data pipelines. Mordor Intelligence currently estimates the market at USD 82.33 billion in 2025 and USD 108.79 billion in 2026, with a projected 2031 value of USD 438.47 billion and a 32.15% CAGR. North America remains the largest regional market, with 32.60% of 2025 revenue.
What data analytics services actually cover
Data analytics services are not a single deliverable; they combine data preparation, modeling, visualization, and reporting so organizations can answer different types of business questions. Depending on your needs, the scope may include descriptive analytics, diagnostic analytics, predictive analytics, or prescriptive analytics.
- Business intelligence and dashboarding: Building and maintaining BI dashboards in Tableau, Power BI, Looker, or Superset so teams can monitor KPIs through self-service access. BI services usually include source connections, metric definitions, dashboard design, and governance controls.
- Data visualization services: Designing charts, graphs, and interactive visualizations that make complex data understandable for business users. This can include time-series analysis, geospatial views, and custom visuals tailored to operational or executive reporting.
- Predictive analytics services: Building forecasting models for churn, sales, inventory, demand, or equipment failure. These projects include data prep, model selection, validation, and deployment into dashboards or operational workflows.
- Data preparation and ETL for analytics: Cleaning, transforming, and structuring raw data so reporting is consistent and accurate. This is often the most time-intensive part of analytics work because dashboard quality depends on the quality of the underlying data.
Architecture decisions that matter
The analytics stack is no longer just about producing reports; it is about making the right trade-offs between governance, speed, and scale. Most mature teams now combine centralized data models with self-service analytics so business users can explore certified datasets without creating conflicting metrics.
- Self-service BI vs. centralized reporting: Self-service tools empower users to explore data independently, while centralized reporting protects consistency. The strongest setups usually combine both through governed datasets and reusable definitions.
- Cloud-native vs. on-premises: Cloud platforms reduce infrastructure overhead and are usually faster to scale. On-premises setups still make sense for organizations with strict sovereignty or compliance requirements.
- Real-time vs. batch analytics: Real-time analytics supports operational monitoring and fast decisions, while batch processing is often enough for regular business reporting. The right model depends on how quickly the decision must be made.
Data analytics with LATAM engineers
CodersLab connects enterprises with Tableau, Power BI, Looker, and data engineering specialists based across LATAM, helping teams get nearshore collaboration with US timezone alignment. This model is especially valuable for organizations that need experienced analytics talent without building a large in-house team from scratch.
For many companies, the appeal is not only cost efficiency but also speed of execution, easier collaboration, and access to certified specialists who can support dashboards, governance, and predictive use cases in one team.
How engagements are structured
Data analytics engagements typically begin with an audit of your current data sources, reporting needs, and dashboard gaps. From there, the team defines the target architecture, key metrics, and delivery phases before implementation starts.
Implementation usually follows a sequence: connect sources, build the model, create the dashboards, validate the data, and document the system. For many projects, core dashboards can be ready in two to four weeks, while a full production environment may take six to ten weeks depending on complexity.
Frequently Asked Questions
Pricing depends on data volume, dashboard complexity, governance needs, and ongoing support requirements. Most projects are scoped after an initial audit so the quote matches the real workload.
Core dashboards can often be delivered in two to four weeks, while a full production environment may take six to ten weeks depending on the number of sources and the level of governance required.
Business intelligence focuses mainly on descriptive analytics, answering what happened through dashboards and reports. Data analytics is broader and can include descriptive, diagnostic, predictive, and prescriptive work.
Yes. CodersLab's analytics specialists work with Tableau, Power BI, Looker, and other modern analytics stacks depending on the client's environment.
Yes. Predictive analytics work can include churn prediction, sales forecasting, inventory planning, and other model-based use cases.
We can connect SQL databases, cloud warehouses, CRMs, marketing platforms, APIs, and flat files, depending on the client architecture.
Data accuracy comes from governed metric definitions, reusable data models, validation checks, and documentation that traces numbers back to their source.
Yes. Training can include dashboard usage, metric interpretation, and self-service BI basics for internal teams.
Specialties & Solutions



Need a tech team?
We build and scale nearshore development teams for companies from startups to Fortune 500. +1,200 projects delivered for over 500 companies across LATAM.

Our process. Simple, seamless, streamlined.

Step 1

Let's schedule a strategic call
Tell us about your project in an exploratory session. We'll discuss team structure, technical needs, timelines, budget, and the skills needed to find the best solution for you.
Step 2

We design the solution and select your teams
In just a few days, we define project details, agree on the work model, and select the ideal talent for you. We ensure each profile integrates quickly and effectively.
Step 3

We launch and optimize performance
With agreed milestones, the team starts working immediately. We track progress, provide continuous reports, and adapt to your needs to ensure the best results.